Abstract
Introduction
Many cancers involve the participation of rare cell populations that may only be found in a subset of patients. Single-cell RNA sequencing (scRNA-seq) can identify distinct cell populations across multiple samples with batch normalization used to reduce processing-based effects between samples. However, aggressive normalization obscures rare cell populations, which may be erroneously grouped with other cell types. There is a need for conservative batch normalization that maintains the biological signal necessary to detect rare cell populations.
MapBatch
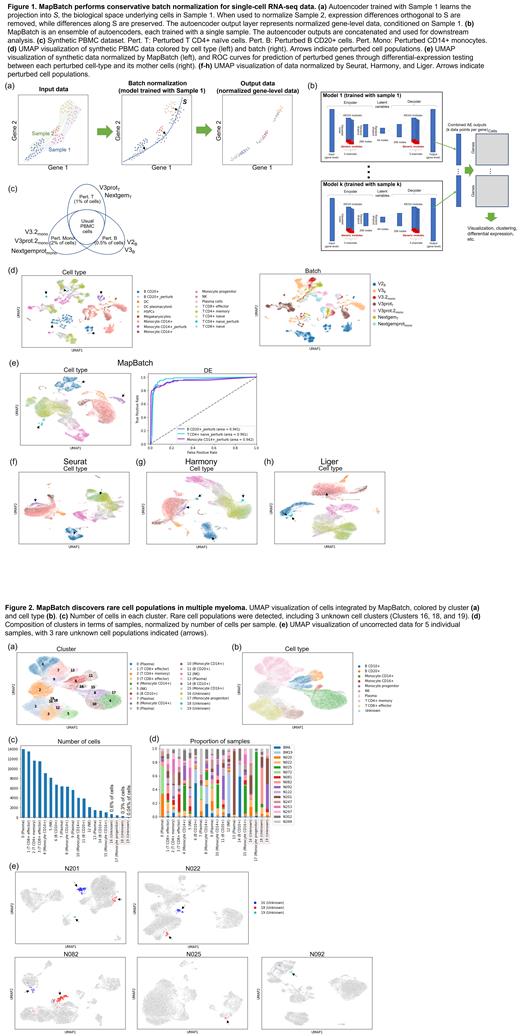
We designed a batch normalization tool, MapBatch, based on two principles: an autoencoder trained with a single sample learns the underlying gene expression structure of cell types without batch effect; and an ensemble model combines multiple autoencoders, allowing the use of multiple samples for training.
Each autoencoder is trained on one sample, learning a projection into the biological space S representing the real expression differences between cells in that sample (Figure 1a, middle). When other samples are projected into S, the projection reduces expression differences orthogonal to S, while preserving differences along S. The reverse projection transforms the data back into gene space at the autoencoder's output, sans expression differences orthogonal to S (Figure 1a, right). Since batch-based technical differences are not represented in S, this transformation selectively removes batch effect between samples, while preserving biological signal. The autoencoder output thus represents normalized expression data, conditioned on the training sample.
To incorporate multiple samples into training, MapBatch uses an ensemble of autoencoders, each trained with a single sample (Figure 1b). We train with a minimal number of samples necessary to cover the different cell populations in the dataset. We implement regularization using dropout and noise layers, and an a priori feature extraction layer using KEGG gene modules. The autoencoders' outputs are concatenated for downstream analysis. For visualization and clustering, we use the top principal components of the concatenated outputs. For differential expression (DE), we perform DE on each of the gene matrices output by each model, then take the result with the lowest P-value.
To test MapBatch, we generated a synthetic dataset based on 7 batches of publicly available PBMC data. For each batch we simulated rare cell populations by selecting one of three cell types to perturb by up and down-regulating 40 genes in 0.5%-2% of the cells (Figure 1c). We simulated additional batch effect by scaling each gene in each batch with a scaling factor. Upon visualization and clustering, cells grouped largely by batch (Figure 1d). After batch normalization, cells grouped by cell type rather than batch, and all three perturbed cell populations were successfully delineated (Figure 1e). DE between each perturbed population and its mother cells accurately retrieved the perturbed genes, showing that normalization maintained real expression differences (Figure 1e). In contrast, three methods tested Seurat (Stuart et al., 2019), Harmony (Korsunsky et al., 2019), and Liger (Welch et al., 2019) could only derive a subset of the perturbed populations (Figures 1f-h).
MapBatch identifies rare populations in multiple myeloma (MM)
We used MapBatch to process bone marrow scRNA-seq data from 14 MM samples and 2 healthy controls. After batch normalization, unsupervised clustering identified 20 clusters, which we annotated using MapCell (Koh & Hoon, 2019) (Figures 2a, 2b). We identified 3 small clusters of cells that could not be reliably annotated, comprising less than 1% of total cells and found in only a subset of patients (Figures 2c, 2d). As validation, we observed that these cells were present in distinct clusters in individual samples using their uncorrected expression data, providing evidence that these clusters were not driven by batch effect nor MapBatch (Figure 2e).
Conclusion
Batch normalization of scRNA-seq data involves a trade-off between minimizing batch effect and maximizing the remaining biological signal. While most methods lean towards the former, MapBatch maintains more biological signal for downstream analysis, enabling the discovery of previously difficult to find cell populations.
Xu: Proteona Pte Ltd: Current Employment. Scolnick: Proteona Pte Ltd: Current holder of individual stocks in a privately-held company. Huo: Proteona Pte Ltd: Ended employment in the past 24 months. Lovci: Proteona Pte Ltd: Current Employment. Chng: Amgen: Honoraria, Research Funding; Abbvie: Honoraria; Janssen: Honoraria, Research Funding; Novartis: Honoraria; Celgene: Honoraria, Research Funding.


This feature is available to Subscribers Only
Sign In or Create an Account Close Modal